Profiling Your Database Workload
Spotting anomalies in your database workload is a whole lot easier if you first have a good understanding of what your database workload normally looks like. A good idea is to profile your workload so you can gauge what’s normal at any given time.
All systems will have varying workload signatures depending on what they are used for. For instance an OLTP system used for stock trading may experience heavy load during market trading hours and then lay dormant when trading ceases. A general ledger system may be subject to heavy workload during nightly batch runs and experience a huge influx of load during month end processing. All workload patterns vary and it’s up to the DBA go determine what these patterns look like.
So how do we build a profile around a databases workload. Well it’s easier than you think and here is a simple little piece of SQL to do it.
select s.snap_id,s.start_time, s.end_time,
'All SQL' as sqlexec,
nvl(sum(x.executions_delta),0) as execs,
nvl(round(sum(x.elapsed_time_delta) /1000000, 4),0) as elpas,
nvl(sum(x.rows_processed_delta),0) as rowsp,
nvl(round(sum(x.disk_reads_delta), 4),0) as readsp,
nvl(round(sum(x.iowait_delta) /1000000, 4),0) as iowaitsp,
nvl(round(sum(x.cpu_time_delta) /1000000, 4),0) as cpup,
nvl(round(sum(x.sorts_delta), 4),0) as sortp,
nvl(round(sum(x.apwait_delta) /1000000, 4),0) as apwaitp,
nvl(round(sum(x.clwait_delta) /1000000, 4),0) as clwaitp,
nvl(round(sum(x.ccwait_delta) /1000000, 4),0) as ccwaitp,
nvl(sum(x.IO_OFFLOAD_ELIG_BYTES_DELTA),0) as iooff,
nvl(sum(x.IO_INTERCONNECT_BYTES_DELTA),0) as ioint,
nvl(sum(x.OPTIMIZED_PHYSICAL_READS_DELTA),0) as optread,
nvl(sum(x.CELL_UNCOMPRESSED_BYTES_DELTA),0) as uncompb,
nvl(sum(x.IO_OFFLOAD_RETURN_BYTES_DELTA ),0) as offb,
nvl(sum(x.DIRECT_WRITES_DELTA),0) as dw,
nvl(sum(x.PHYSICAL_READ_REQUESTS_DELTA),0) as phyrr,
nvl(sum(x.PHYSICAL_READ_BYTES_DELTA),0) as phyrb,
nvl(sum(x.PHYSICAL_WRITE_REQUESTS_DELTA),0) as phywr,
nvl(sum(x.PHYSICAL_WRITE_BYTES_DELTA),0) as phywb,
nvl(sum(x.PARSE_CALLS_DELTA),0) as parse,
nvl(sum(x.LOADS_DELTA),0) as loads,
nvl(sum(x.INVALIDATIONS_DELTA),0) as invalid,
nvl(sum(x.BUFFER_GETS_DELTA),0) as gets,
nvl(sum(x.FETCHES_DELTA),0) as fetch,
nvl(sum(x.END_OF_FETCH_COUNT_DELTA),0) as eofetch
from
(select snap_id,
sql_id,
plan_hash_value,
executions_delta,
elapsed_time_delta,
rows_processed_delta,
disk_reads_delta,
iowait_DELTA,
cpu_time_DELTA,
sorts_DELTA,
apwait_DELTA,
clwait_DELTA,
ccwait_DELTA,
IO_OFFLOAD_ELIG_BYTES_DELTA,
IO_INTERCONNECT_BYTES_DELTA,
OPTIMIZED_PHYSICAL_READS_DELTA,
CELL_UNCOMPRESSED_BYTES_DELTA,
IO_OFFLOAD_RETURN_BYTES_DELTA,
DIRECT_WRITES_DELTA,
PHYSICAL_READ_REQUESTS_DELTA,
PHYSICAL_READ_BYTES_DELTA,
PHYSICAL_WRITE_REQUESTS_DELTA,
PHYSICAL_WRITE_BYTES_DELTA,
PARSE_CALLS_DELTA,
LOADS_DELTA,
INVALIDATIONS_DELTA,
BUFFER_GETS_DELTA,
FETCHES_DELTA,
END_OF_FETCH_COUNT_DELTA
from dba_hist_sqlstat ) x,
(select snap_id,
max(to_char((trunc(begin_interval_time, 'mi')),'DD/MON/YYYY HH24:MI:SS')) as start_time,
max(to_char((trunc(end_interval_time, 'mi')),'DD/MON/YYYY HH24:MI:SS')) as end_time
from dba_hist_snapshot
where begin_interval_time >= sysdate-7
group by snap_id
) s
where s.snap_id = x.snap_id
group by s.snap_id,s.start_time, s.end_time
order by s.snap_id
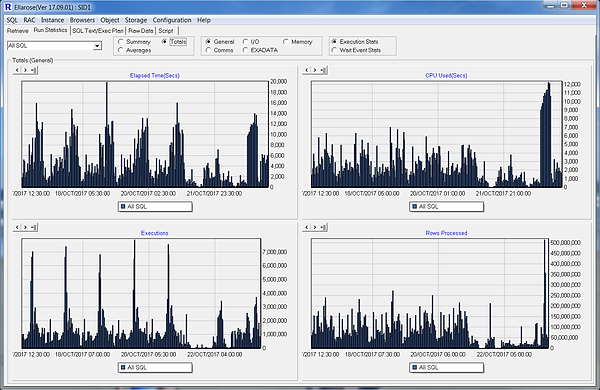
The above query can be plugged straight into the "Speedway" performance tuning software to produce a fantastic graphical representation of your databases workload profile as per below:
Illustration 1: Workload summarised over a 1 week period

Illustration 2: Workload plotted over a 1 week period showing various key metrics